Suggesting an economy makes “no landing” makes no sense. Analogies eventually break down, especially this one. Economic activity does not stop like an airplane eventually does, but rather the economy will settle into a steady state where growth is consistent with factors such as population and productivity. Here we take a look at some factors that illustrate how the economy is struggling to find a stable growth path.
Why The “Landing” Analogy?
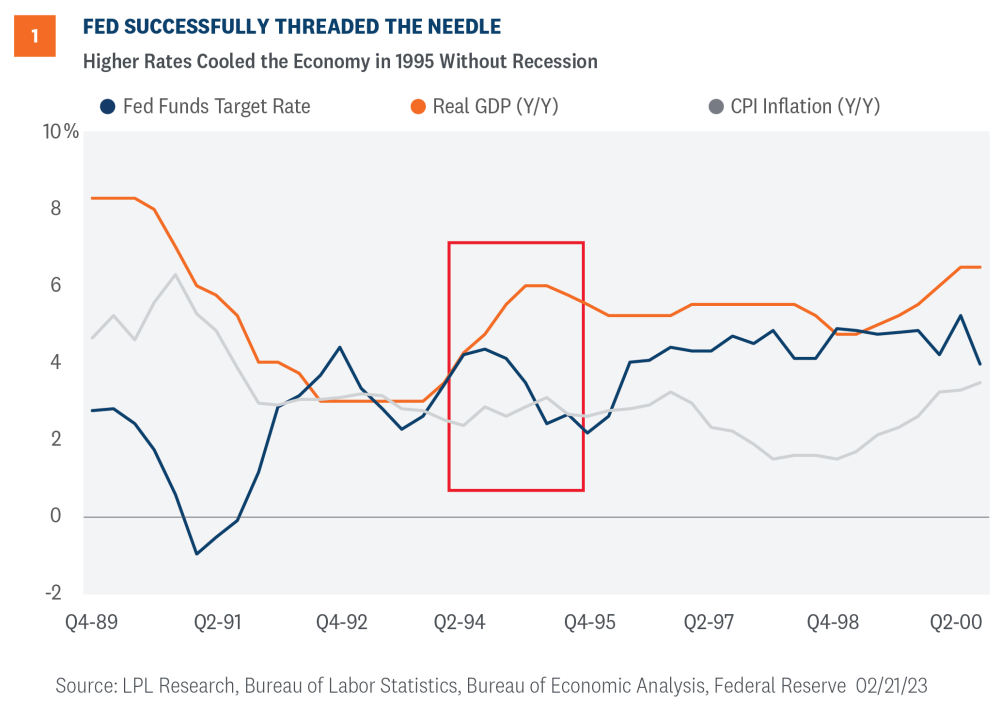
We need to go back a few years to recall when investors began using the “landing” analogy. During the hot summer of the mid-1990s, the Honorable Alan Greenspan spoke to the Economic Club of New York, where he was introduced as “the pilot we are all counting on for that very smooth and we hope very soft landing.”
Perhaps that was not the first time market watchers used the term, but the conversations at the Economic Club of New York were prescient. The hope for a soft landing came to fruition. The economy started overheating in 1994, so the former chairman of the Federal Reserve (Fed) raised rates, cooled the overheated economy, and the country escaped a second recession that decade (Figure 1).
What is a Soft or Hard Landing?
A soft landing is when economic growth slows but remains positive as the economy sets up for a long-term sustainable growth path. In contrast, a hard landing means the country falls into recession to break the overheated economic machine. One assumption behind the analogy is an overheated economy is not on a sustainable growth path, so policy makers ought to tighten financial conditions to improve the economy’s chances of reaching a stable growth rate.
Why a “No Landing” Makes No Sense
Suggesting an economy makes “no landing” makes no sense. Analogies eventually break down, especially this one. Economic activity does not stop like an airplane eventually does, but rather the economy will settle into a steady state where growth is consistent with factors such as population and productivity.
So perhaps it’s time to rethink the use of the “landing” analogy and use one related to that of a runner. Runners often talk about the various phases of the race. One important phase is when runners transition from the acceleration phase, when they focus on increasing stride length and frequency, to a steady state, when runners focus on maintaining stride length and frequency over time. Central bankers are looking for ways to get the economy “hitting its stride” with a consistent, sustainable growth path and stable prices.
Factors Keeping the Economy Off-Stride
The conundrum is investors are regularly receiving a mix of both good and bad news. One example is the slow recalibration of goods and services spending. During those early years of the pandemic, consumers reallocated more on goods and less on services. The return to “normal” has been slow as the share of services spending is still roughly 2.5 percentage points below pre-pandemic share as of the latest report (Figure 2).
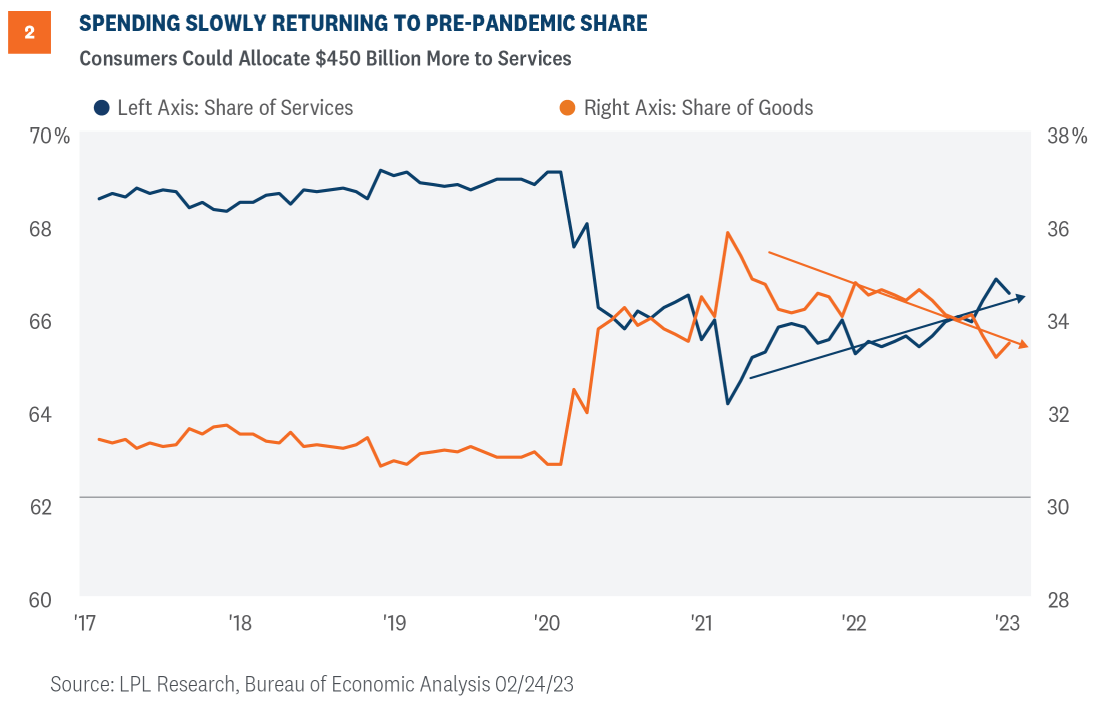
Investors should take note on the composition of spending to understand the underlying inflationary trends. This differential means consumers could allocate roughly $450 billion in services as the composition of spending normalizes throughout the year. Investors and policy makers must accept that inflation metrics will be skewed until consumers recalibrate their composition of spending. Watch for renewed demand for health care, communication services, retail, and financial services.
Another conundrum is the divergence of construction activity between single-family versus multi-family dwellings, but growing multi-family construction activity is clearly a good sign for renters in this country (Figure 3).
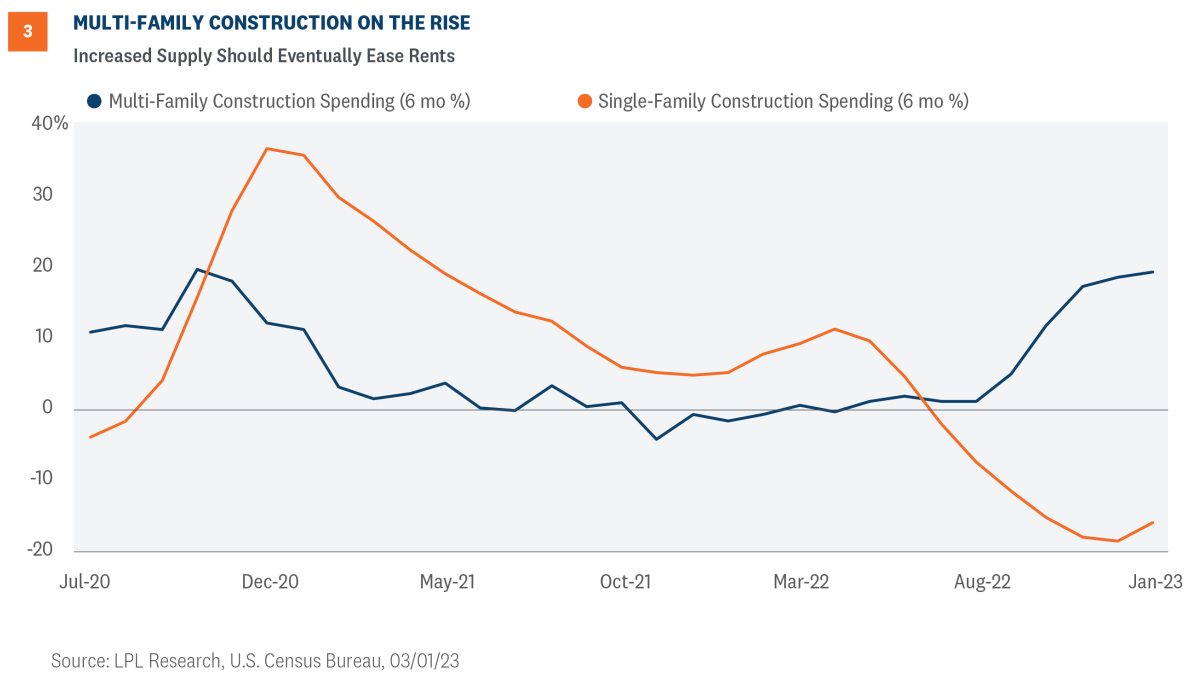
The growth in condo and apartment construction means the supply of multi-family units will increase this year as more projects come to market. New multi-family projects will likely dampen rents as more properties come online, so we should expect rent prices to decline this year as supply of units grows. Industry data already show declining rent prices, so it’s just a matter of time before the official government statistics reflect that easing. Investors and policy makers alike should expect a softening in housing-related inflation in the coming months.
What Does This Mean for You?
The Fed wants to tighten financial conditions so the economy can smoothly transition from the post-pandemic reopening phase—when the economy grew 5.9% in 2021 and 2.1% in 2022— to a more sustainable rate that neither stokes inflation nor stalls economic growth.
If the economy can break the back of inflation without a deep and prolonged recession, investors will likely experience markets that could return to lower volatility and improved conditions for both bond and equity investors. We think the economy will eventually hit its stride, notwithstanding unforeseen global shocks. Hitting that stride may not come until the Fed’s rate hiking campaign is closer to its end, but we expect stock investors to benefit once it does.
Higher interest rates are challenging stock valuations and perhaps pushing the gains further out in 2023, but we still see solid potential for double-digit returns for stocks this year. The LPL Research Strategic and Tactical Asset Allocation Committee (STAAC) recommends a slight overweight allocation to equities, favors value over growth, small caps over large caps, and the energy, healthcare, and industrials sectors.
IMPORTANT DISCLOSURES
This material is for general information only and is not intended to provide specific advice or recommendations for any individual. There is no assurance that the views or strategies discussed are suitable for all investors or will yield positive outcomes. Investing involves risks including possible loss of principal. Any economic forecasts set forth may not develop as predicted and are subject to change.
References to markets, asset classes, and sectors are generally regarding the corresponding market index. Indexes are unmanaged statistical composites and cannot be invested into directly. Index performance is not indicative of the performance of any investment and do not reflect fees, expenses, or sales charges. All performance referenced is historical and is no guarantee of future results.
Any company names noted herein are for educational purposes only and not an indication of trading intent or a solicitation of their products or services. LPL Financial doesn’t provide research on individual equities.
All information is believed to be from reliable sources; however, LPL Financial makes no representation as to its completeness or accuracy.
U.S. Treasuries may be considered “safe haven” investments but do carry some degree of risk including interest rate, credit, and market risk. Bonds are subject to market and interest rate risk if sold prior to maturity. Bond values will decline as interest rates rise and bonds are subject to availability and change in price.
The Standard & Poor’s 500 Index (S&P500) is a capitalization-weighted index of 500 stocks designed to measure performance of the broad domestic economy through changes in the aggregate market value of 500 stocks representing all major industries.
The PE ratio (price-to-earnings ratio) is a measure of the price paid for a share relative to the annual net income or profit earned by the firm per share. It is a financial ratio used for valuation: a higher PE ratio means that investors are paying more for each unit of net income, so the stock is more expensive compared to one with lower PE ratio.
Earnings per share (EPS) is the portion of a company’s profit allocated to each outstanding share of common stock. EPS serves as an indicator of a company’s profitability. Earnings per share is generally considered to be the single most important variable in determining a share’s price. It is also a major component used to calculate the price-to-earnings valuation ratio.
All index data from FactSet.
This research material has been prepared by LPL Financial LLC.
Securities and advisory services offered through LPL Financial (LPL), a registered investment advisor and broker-dealer (member FINRA/SIPC). Insurance products are offered through LPL or its licensed affiliates. To the extent you are receiving investment advice from a separately registered independent investment advisor that is not an LPL affiliate, please note LPL makes no representation with respect to such entity.
Not Insured by FDIC/NCUA or Any Other Government Agency | Not Bank/Credit Union Guaranteed | Not Bank/Credit Union Deposits or Obligations | May Lose Value
RES-1452953-0323 | For Public Use | Tracking #1-05362710 (Exp. 03/24)